Technology M&A: Software Sector Update – Q1 2024
Software Valuation Insights – Q1 2024
Our quarterly Software Industry Report is a vital resource for SaaS founders, CEOs, and investors, offering comprehensive analysis and insights into the valuation of public software companies. The report is divided into ten benchmark segments, providing a detailed examination of the performance and outlook across various software verticals.
It delivers essential data and trends, enabling informed decision-making in the rapidly evolving software industry.
Q1 Updates:
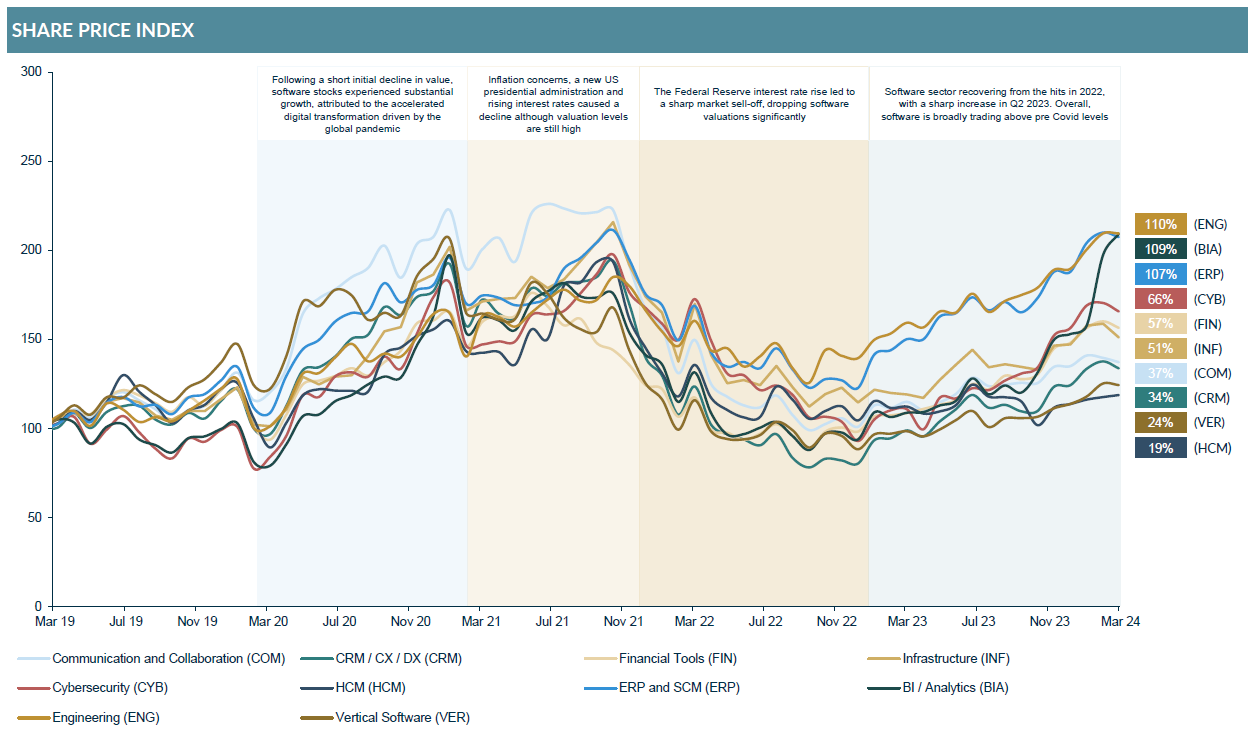
The software sector shows a healthy dose of optimism as several factors point towards a more favourable macroeconomic environment, which is reflected in valuation levels continuing to broadly trade above pre-covid levels.
- Private market activity is subsequently picking up in Q1-24 compared with 2023 while deal volume is expected to ramp up earliest in H2 2024, with potential to slip into H1 2025.
- While growth remains the primary driver of value, companies that balance growth with profitability are being rewarded with premium valuations as Rule of 40 is a clear focus for investors.
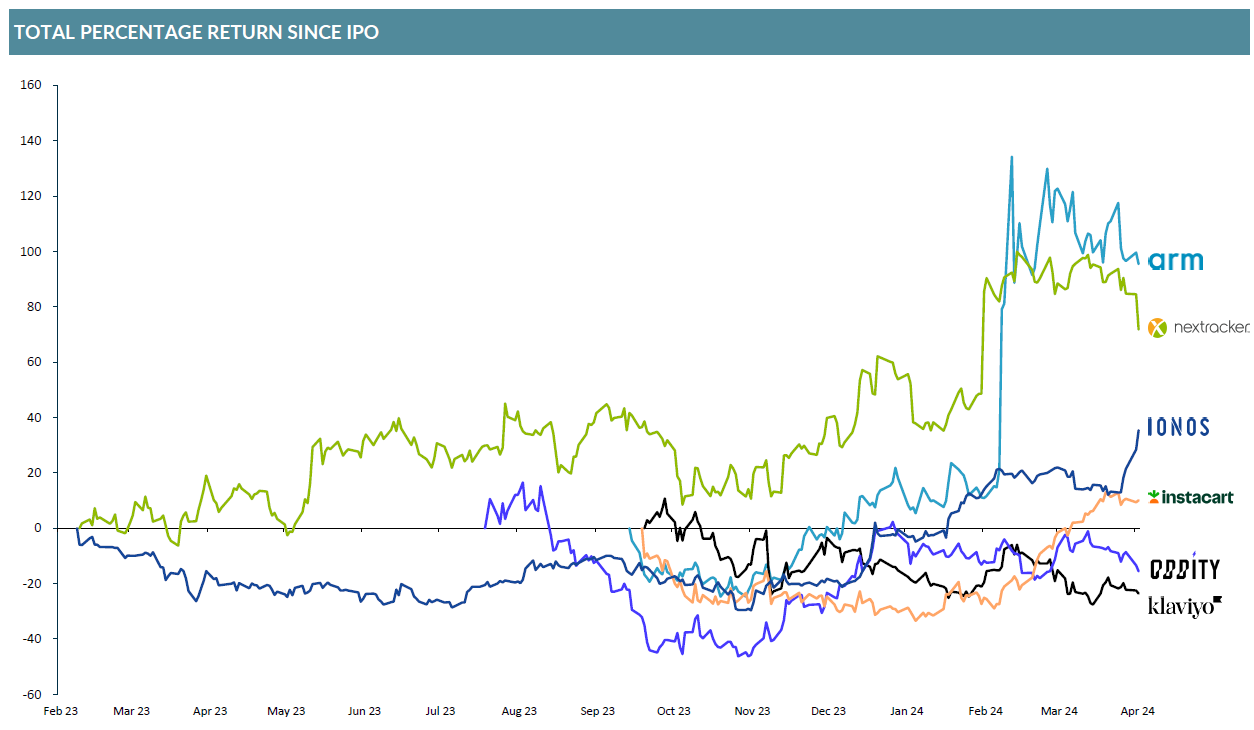
Additionally, the report features a deep dive into the performance of Tech IPOs in 2023. As of the end of Q1-24, it shows that four out of six highlighted companies are trading above IPO price, with high investor appetite for companies benefitting from the roaring interest in AI.
Key Takeaways | Q1 2024 Public Software Valuations
- Healthy dose of optimism in the market reflected in software valuation levels
Valuation levels continue recovery trajectory as seen in 2023 from the lows in 2022, supported by several factors pointing towards a more favourable macroeconomic environment.
- Private market activity is picking up in Q1 as the software ecosystem continues to stabilise
After a longer period of reduced deal volumes, the private market activity is expected to pick up, especially looking towards H2 2024 / H1 2025, supported by improving public market performance.
- Rule of 40 has clearly replaced growth at all costs as investors now focus on profitable growth
Investor demand is greater for companies that can prove Rule of 40, sustained revenue retention metrics and preferably are tackling a mission-critical use case such as e.g. cybersecurity.
The Public Market is due for a comeback following the trough of last year
Public markets have seen significant shifts in terms of investor interest, but emerging trends are illustrating a resurgence.
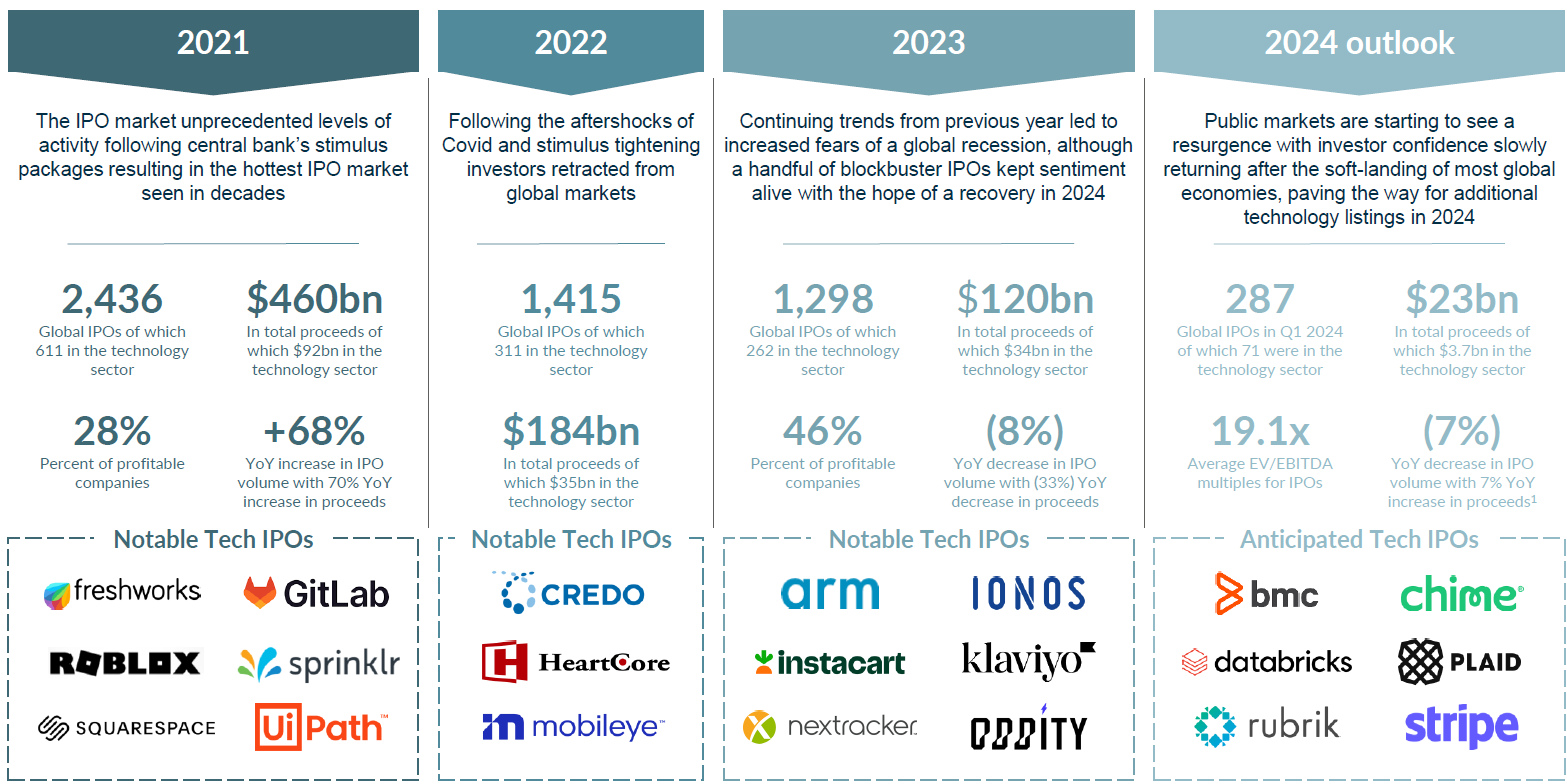
Amidst recent years‘ macroeconomic fluctuations, public markets have witnessed tumultuous conditions, but emerging indications are suggesting gradual restoration of stability.
Notes: 1) Q1 2024 percentage change vs. Q1 2023
Sources: D.A Davidson MCF International Research; EY Global IPO Trends Q1 2024
Overview of recent public offerings in the technology space
There is a clear distinction among recently listed technology firms with AI playing a key role in determining investor appetite.
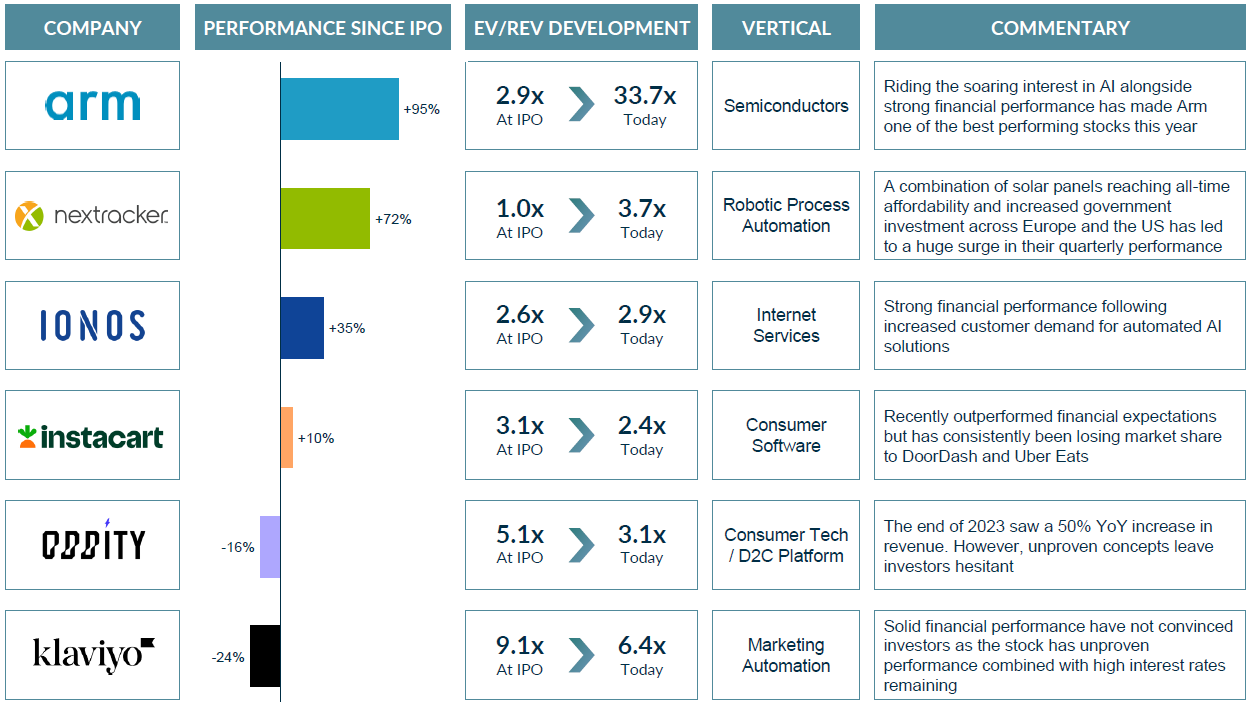
4 out of 6 recently listed technology companies are trading above IPO price
Technology companies have experienced a varied response from investors with a high level of optimism centralised among a handful of firms.
Software is broadly trading above pre-covid levels again
As several factors point towards a more favourable macroeconomic environment the market shows a healthy dose of optimism being reflected in software valuation levels.
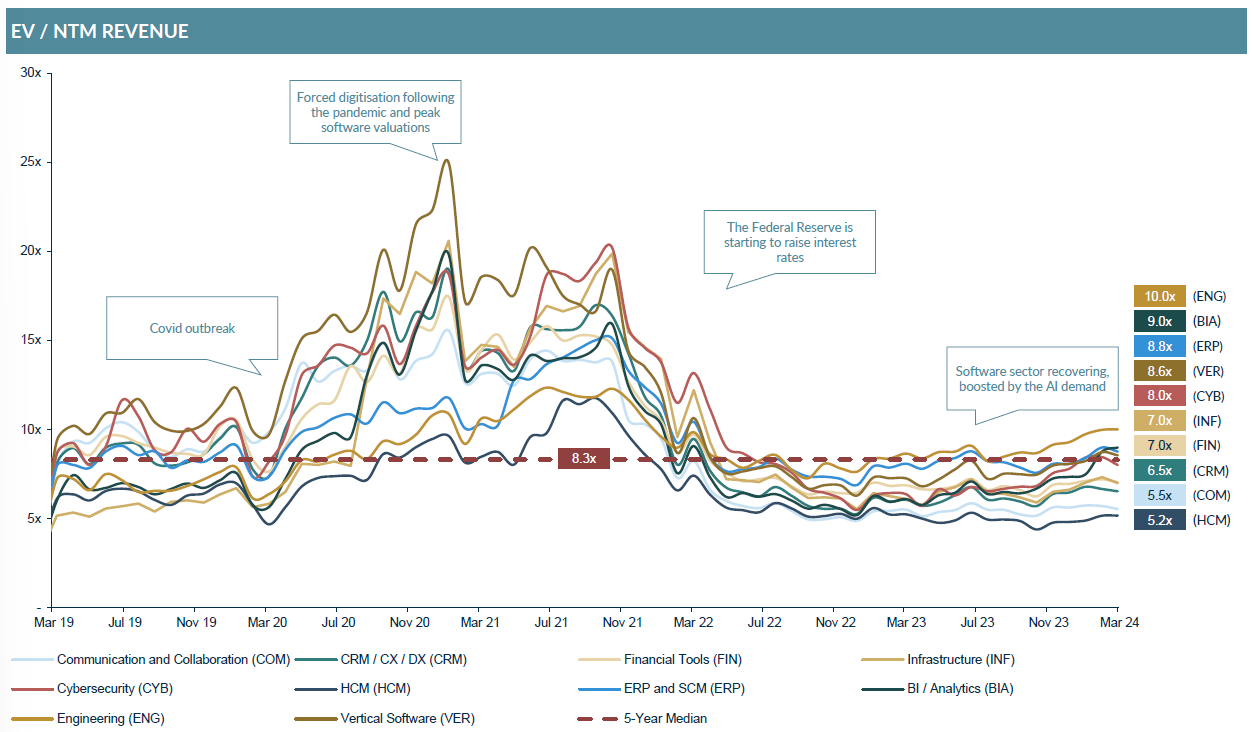
Strong growth of public market valuations across all software sector verticals
The final quarter of 2023 saw a strong growth in EV/NTM revenue valuations, with the highest valued verticals also having the highest profitability, demonstrating the shift from growth at all costs to increased importance of Rule of 40 as valuation driver.
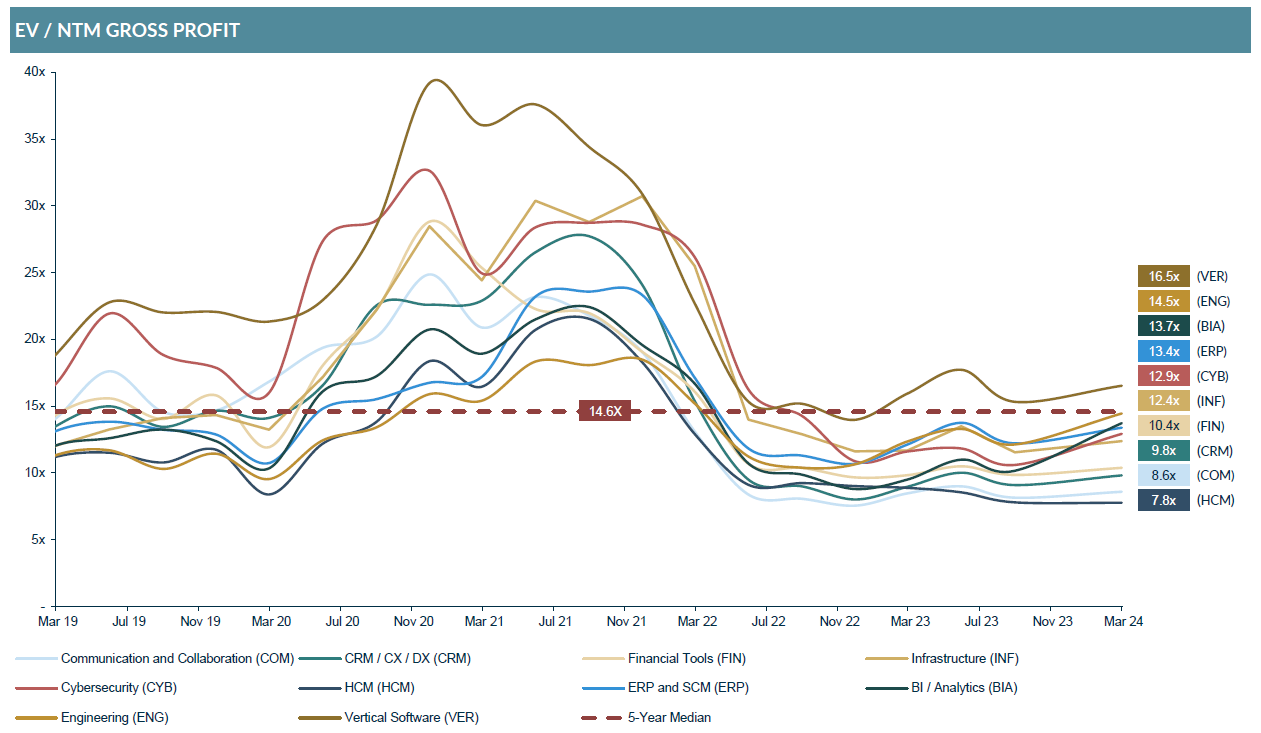
Brighter future profit potential is driving higher gross profit multiples
Gross Profit multiples could be proxy for EBITDA multiples for software companies as it indicates the future profit potential per dollar of current revenue.
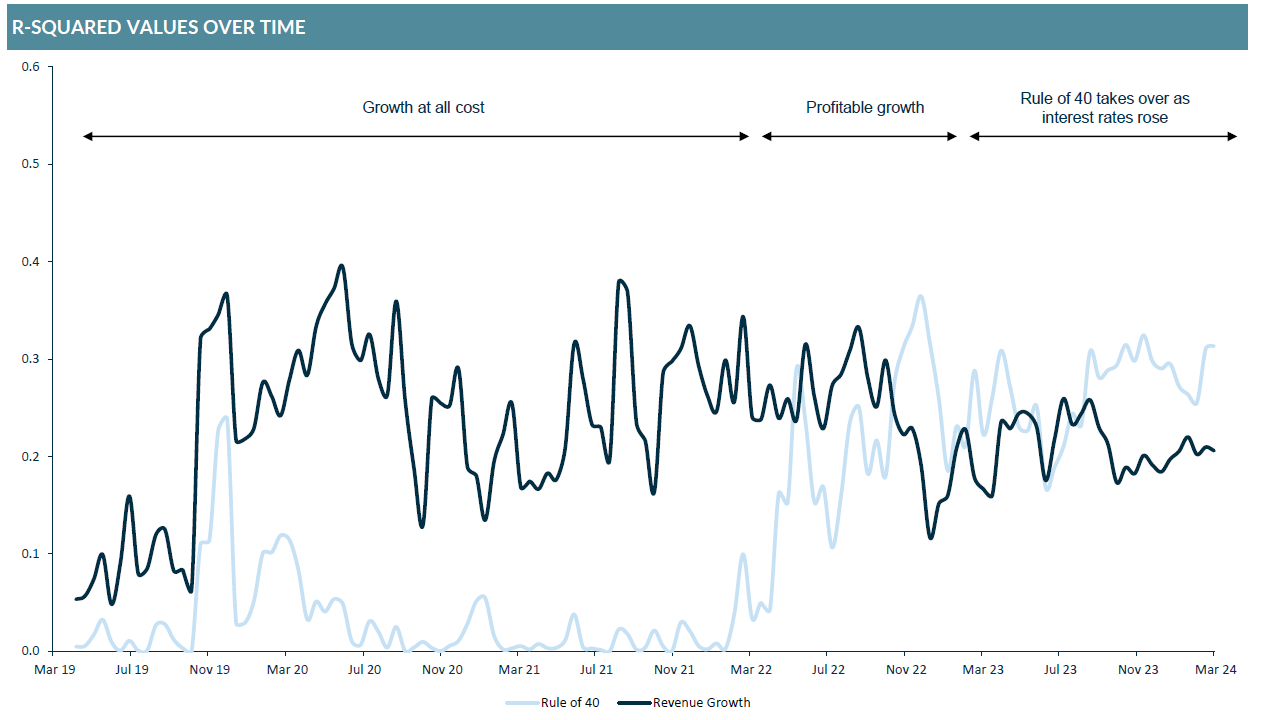
Increasing relevance of the Rule of 40 as growth slows down…
Whereas growth was the primary driver of valuation during covid, the combination of profitability and growth (i.e. “profitable growth”) has taken over (Rule of 40).
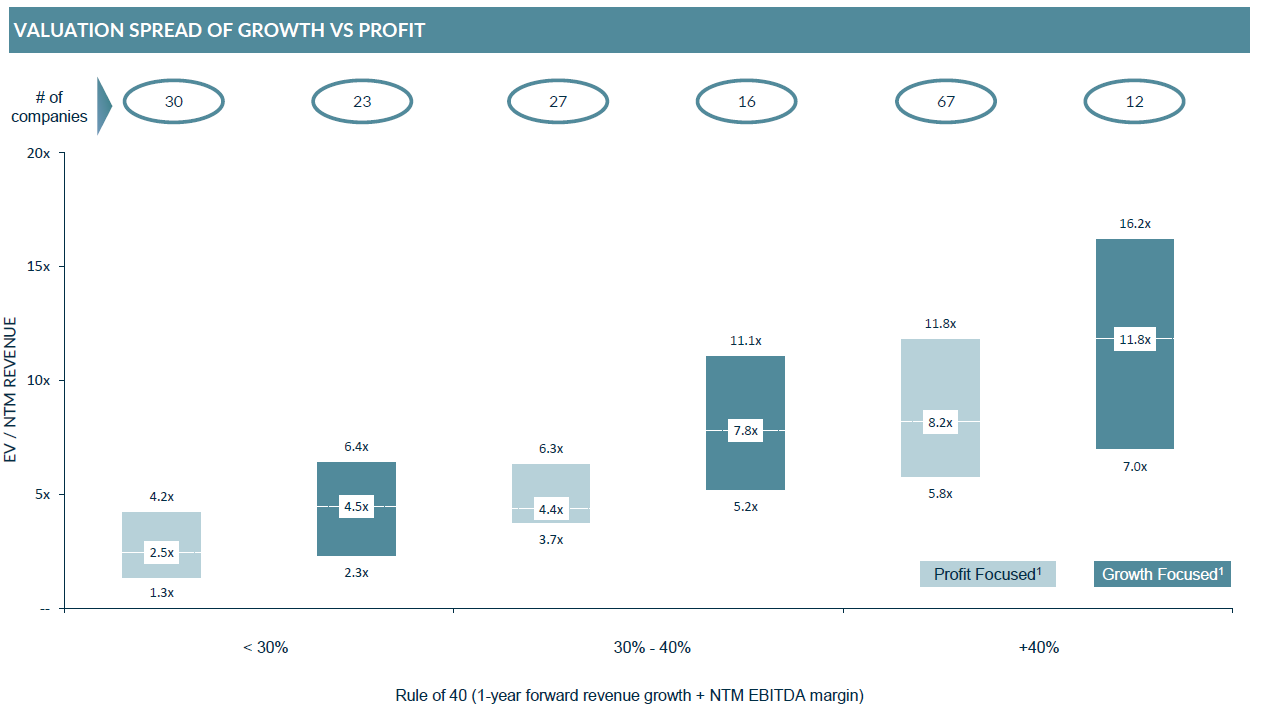
…Although growth remains the dominant value driver over profit
Investors now look at a combination of profit and growth to determine valuation, while growth remains the more important constituent in the Rule of 40 rather than profitability.
For the full Software report please download the accompanying PDF which is available at the top of the page. The report contains full public market valuations and more information on our transatlantic M&A services.
Get in touch
If you would like to discuss the report or have a question on the valuation of your company please get in touch with a member of our technology team.
You can more information on our technology services including our leading network of industry advisors here.
Related Software Sector Content
Software valuations report – Q3 2024
Get in touch


